Prices fell in February for the first time in 131 months, which could bring more buyers to the market just in time for spring, according to NAR’s latest housing report.
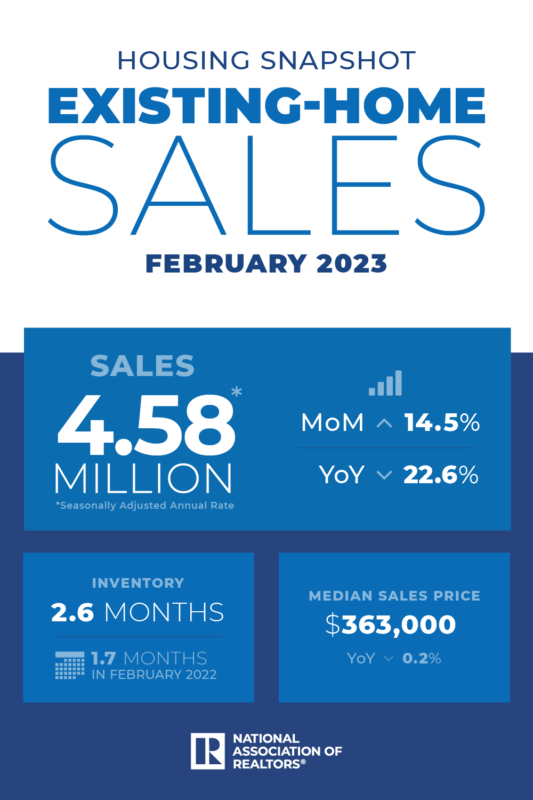
Existing-home sales ended a yearlong decline in February, posting gains for the first time in 12 months, the National Association of REALTORS® reported Tuesday. Existing-home sales increased 14.5% month over month—which marked the largest monthly gain since July 2020—reaching a seasonally adjusted annual rate of 4.58 million, NAR data shows. Still, total existing-home sales—which include completed transactions for single-family homes, townhomes, condos and co-ops—were down about 23% compared to a year earlier.
But February’s uptick is a hopeful sign that the housing market is adjusting to mortgage rates that are nearly double what they were a year ago. Many home buyers are still sitting on the sidelines ready to make a move. “Conscious of changing mortgage rates, home buyers are taking advantage of any rate declines,” says NAR Chief Economist Lawrence Yun. “We’re seeing stronger sales gains in areas where home prices are decreasing and the local economies are adding jobs.”
Home buyers don’t have an abundance of options. Inventory remains tight in many markets and is at historic lows, Yun adds. “Consequently, multiple offers are returning on a good number of properties.” Here’s a closer look at more key housing indicators from NAR’s latest housing report:
- Home prices: Ending a decade of year-over-year increases—the longest upward streak on record—home prices posted a slight annual decline in February. The median existing-home price for all housing types fell 0.2% year over year to $363,000. Still, not all markets are seeing moderating prices. For example, prices continued to climb in the Midwest and South last month.
- Inventory: The number of unsold existing homes remained at a similar level compared to January: the equivalent of a 2.6-month supply at the current monthly sales pace. Still, that’s improved from an even brisker 1.7-month pace a year earlier.
- Days on the market: Fifty-seven percent of homes sold in February were on the market for less than a month. Properties remained on the market an average of 34 days in February, up from a much quicker pace of just 18 days a year earlier.
- First-time home buyers: First-time buyers accounted for 27% of sales in February, down from 31% in January and 29% a year earlier.
- All-cash sales: All-cash sales comprised 28% of transactions in February, up from 25% a year earlier. Individual investors and second-home buyers tend to make up the biggest bulk of cash sales. They accounted for 18% of sales in February, down from 19% a year ago.
- Distressed sales: Foreclosures and short sales continue to make up a small amount of transactions, comprising just 2% of sales in February, about the same as in January and a year earlier.
Regional Breakdown
Here’s a closer look at how existing-home sales fared in February across the country:
- Northeast:Sales increased 4% compared to January, reaching an annual rate of 520,000. But that is down 25.7% compared to a year earlier. Median price: $366,100, down 4.5% from the previous year.
- Midwest: Sales increased 13.5% compared to January, reaching an annual rate of 1.09 million. Sales are down 18.7% from a year ago. Median price: $261,200, up 5% from a year ago.
- South: Sales increased 15.9% compared to January, reaching an annual rate of 2.11 million. But that still marks a 21.3% decrease from the prior year. Median price: $342,000, an increase of 2.7% from a year ago.
- West: Existing-home sales rose 19.4% compared to January, reaching an annual rate of 860,000. Sales were down 28.3% from a year ago. Median price: $541,100, down 5.6% from a year ago.
Source: nar.realtor


